Stock Market Seasonality Charts 2023
Stock Market Seasonality Charts are a very good technique to optimize your timing for entry and exit.
Seasonality of Stock Market
Seasonal patterns in the stock market are often caused by economic cycles. For example, when the economy is doing well, people tend to spend money on big ticket items like cars and houses. This boosts demand for stocks that are tied to those purchases. As the economy improves, people start saving again, which causes demand for stocks tied to savings to rise.
BUT, Be Careful.
Looking at a simple seasonal chart is not enough!
You need a backtest and KPIs to see the quality of the seasonal pattern.
The quality of your analysis determines your success.
Some Seasonal Examples of the Stock Market
Would you like more Seasonality Stock Charts. Our Seasonality Chart Analyzer offers free analyzable instruments. As a subscriber to our Seasonality Essential service, you have access to all instruments on our platform.
1. SPY (SPX) SP500 ETF - Sell in May
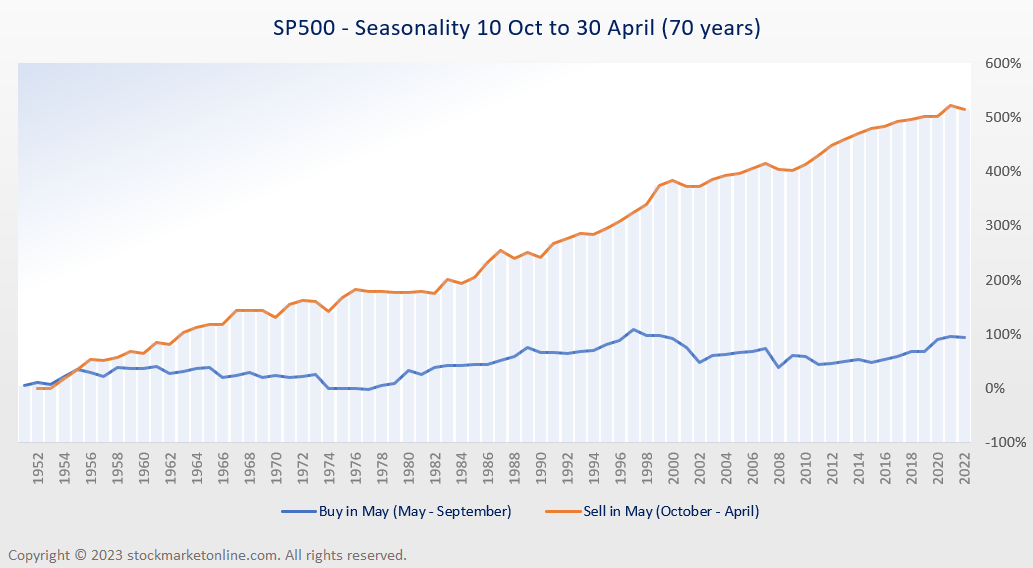
The best-known seasonal pattern on the stock market is: "Sell in may and go away but remember to come back in september!"
Prices rise much more from October to April than from May to the end of September.
2. MSFT: Microsoft Seasonality Chart
Microsoft almost always publishes better results than forecast in Q3.
This creates a stable, recurring pattern with a high hit rate from which you can profit.
3. YUM: YUM BRANDS
YUM! Brands, Inc. is the world's largest operator of quick-service restaurants.
Regularly, the share price rises for three months from the beginning of March.
The hit rate of this seasonal pattern has a hit rate of over 95%. The Sortino Ratio is very high, which suggests a very high and consistent performance.
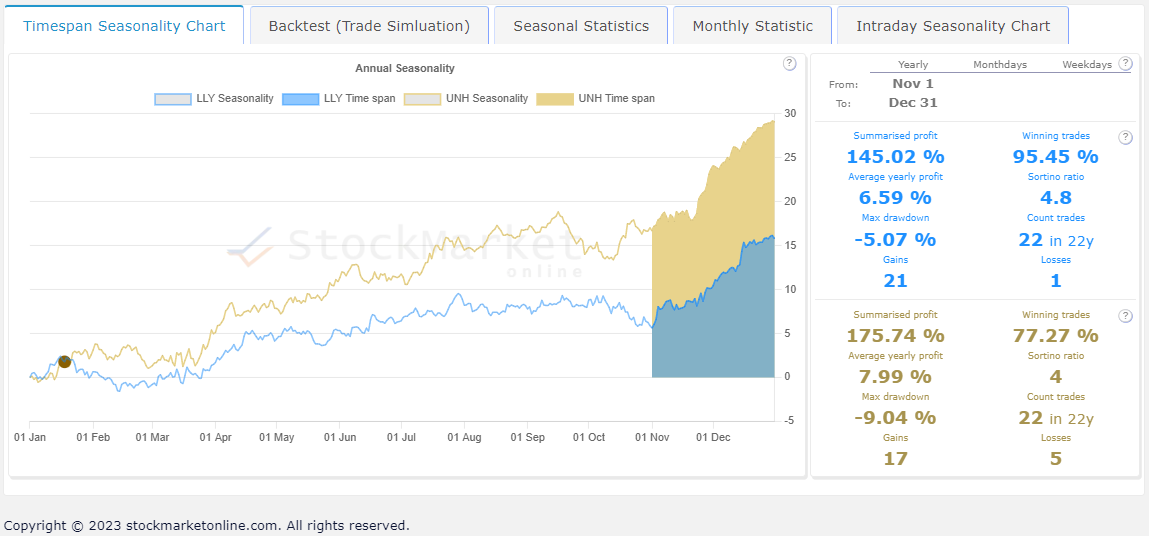
4. LLY vs UNH: Seasonal Chart of Eli Lilly (LLY)
The seasonal chart of Eli Lilly and Company is particularly strong in the last 2 months of the year.
The price increases are regularly generated by positive corporate earnings.
The positive seasonal pattern can also be found across the healthcare sector.
Let's look at a some examples
But there are many more good opportunities.
""Sell in May and go away, but remember to come back in September!""
The following chart shows the different performance of the SP500 over the last 70 years if it had been bought or sold in May.
Prices rise much more from October to April than from May to the end of September.
The chart shows the seasonal performance of gold, silver, copper, palladium and platinum.
These precious metals rise the most in the first weeks of the year compared to the rest of the year.
For example, the SP500 has always closed in positive territory in the year before an election.
The year following an election also has a very good hit rate of over 87% in which the SP500 closes the year with a gain.
The worst performance is in the mid-term election year. Those who have to invest in a mid-term election year can optimise their profits by applying the Sell in May rule.
The hit rate is very good. Only in 2003 and 2012 was there a significant loss. In all other years, the share price rose.
On 11 occasions, the share price even rose by more than 10%.
In this example, it is clear that the Eli Lilly share has a better hit rate (over 95%).
Comparisons are an essential part of any analysis.
The monthly pattern shows that in the second half of the month, the TLT ETF has gained a total of 183.41% over the past 20 years.
This is equivalent to an average annual return of 9.17%.
The screener offers numerous filters that you can customise to suit your needs.
Get the best entry and exit signals with just a few clicks.
This gives you a clear overview and allows you to focus on your preferred asset class.
This data helps to identify good recurring price patterns.
Recurring, seasonal trends yield the same gains in a few weeks as normal investments do in a year.
The quality of your analysis determines your success.
You need a backtest to see if the recurring pattern has produced stable profits in each period and what drawdown has occurred.
Other statistical key figures and charts show qualitative details of monthly, weekly and weekday performance.
For the optimal time to buy, we show seasonal intraday charts for instruments with high trading volume.
If you want to use seasonality profitably, you need more than just a seasonality chart.
Our Seasonality Chart Analyzer shows you all relevant data for your analyses and your success.
Use the best seasonal patterns for your success.
Professional analysis tools for your success
All three Seasonality tools are part of the Seasonality Essential subscriber offer.
Why Is There A Seasonal Pattern In Stocks?
If you're looking for an investment strategy that will help you beat the market year after year, there's no better place to start than with seasonal investing. Seasonal investing is based on the idea that certain industries do better during certain times of the year. For example, the housing industry tends to perform better in the spring and summer months because more people are buying homes.
There are many studies the seasonal effect is well described. You can find a list of studies in the following post What Is Seasonility? How It Works.
Price developments of stocks, currencies and commodities are the result of economic or corporate developments. Economic and corporate developments repeat themselves and automatically generate recurring (seasonal) patterns. There are also weather-related reasons that influence the demand for commodities or products.
When Should You Buy And Sell Stocks?
There are two main reasons why you should consider seasonal investing. First, it helps you avoid making costly mistakes by avoiding investments that aren't performing well at the moment. Second, it gives you the opportunity to make money when others are losing money.
There are many different reasons for the right time to buy and sell. Using seasonal effects is a good choice and has long been established in the financial industry. To identify the right time to buy and sell you just need the right platform, which will search for the opportunities and allow you to analyze them.
Which Months Are Best For Buying And Selling Stocks?
If you're looking to invest in stocks, there's no better time than right now. In fact, the first three months of each year tend to be the strongest for the stock market. This is because companies typically report earnings during these months, and those earnings will help determine whether the company is going to perform well or poorly.
What Happens To The Stock Market During The Summer?
While the stock market tends to do well in the spring and fall, it tends to do worse in the summer. Why? Because people spend more time outdoors and less time inside watching TV and playing video games. As a result, fewer people are buying new products and services, so businesses aren't making as much money.
Seasonality can improve the timing of their investment and trading activities. Analyze strong recurring trends and find the best opportunities with our Seasonality Screener.


