Market Indicators - What is it?
Market Indicators are designed to identify risk and potential investment opportunities.
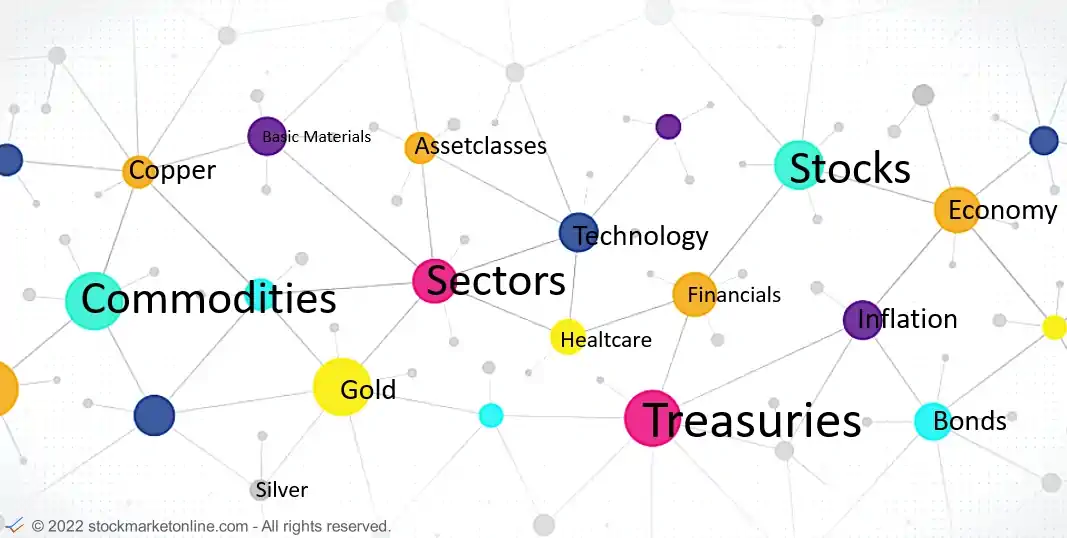
Market Indicators
All major asset classes are interrelated and compete with each other. Depending on the market situation, the asset classes differ in their return and risk potential.
The analysis of markets, asset classes and correlations open up profit potentials and is an essential part of risk management.
We offer you access to selected risk models, comparisons and valuations of interesting markets, asset classes and much more.
The offered market indicators are designed for macro and Big-Picture analysis.
What is it?
If the Big-Picture of the stock markets consists of differently sized or differently relevant individual parts, the Market Indicators show the permanently relevant areas.
Market Indicators is a compilation of different market models and different comparison charts.
The market valuation models have been developed stockmarketonline.com to quickly obtain a short and medium term risk assessment of the US stock market.
Correlated dependent markets often show early problems in the stock market through their strength or weakness. With our chart compilation, risk analyses are easier to implement.
The comparative charts show different markets, fundamental economic data and positioning of individual market segments.
Identify which markets, regions or sectors are outperforming or underperforming.
The chart compilation includes the stock and money markets, as well as important developments in fiscal policy and commodities.
Stock Market Risk Models
Risk Models:
-
US SMO Institutional Protection Indicator
-
US SMO Economic Stress Indicator
Both models are designed to identify risks in the US equity market.
The "US SMO Institutional Protection Indicator" model shows short-term risks. It is a leading indicator that identifies risks with a lead time of about 1-6 weeks. Among other things, this model is ideally suited for portfolio hedging with options.
The "US SMO Economic Stress Indicator" model shows rather long-term risks, which are often related to a recession.
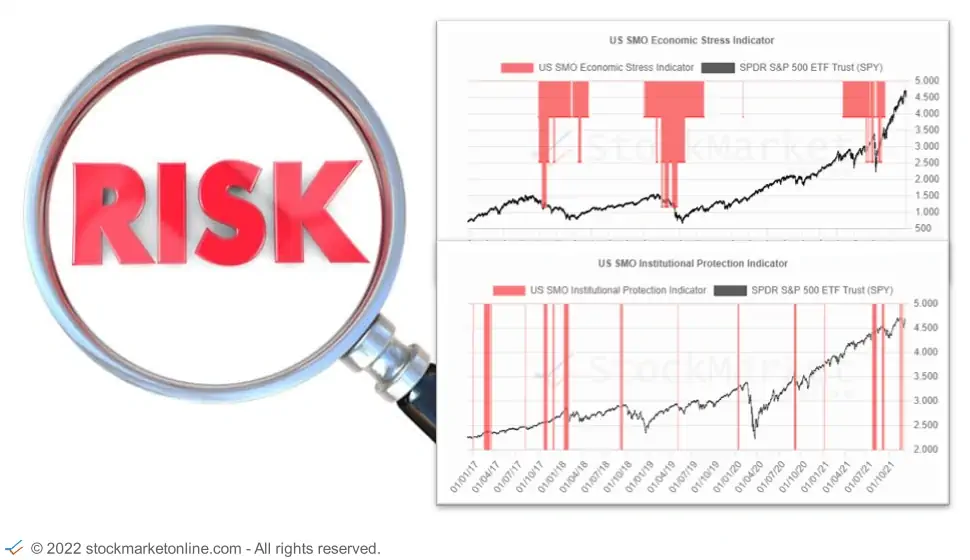
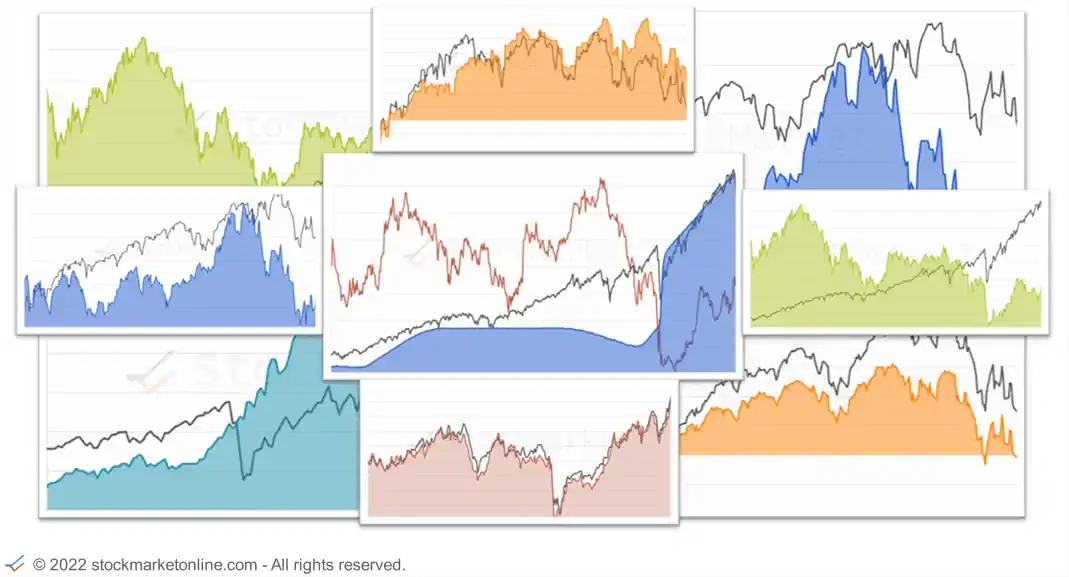
Chart compilation
The comparative charts show different markets, fundamental economic data and positioning of individual market segments.
Identify which markets, regions or sectors are outperforming or underperforming.
Correlated dependent markets often show early problems in the stock market through their strength or weakness. With our chart compilation, risk analyses are easier to implement.
Each comparative chart contains at least two components. Mostly it is a market and a relevant counterpart. The counterpart can be another market, a fundamental/economic data series or the positioning of the participants of a market.
If you have any questions or suggestions, please do not hesitate to E-mail us.
With our service you get access to all Market Indicators.